 EMODnet Product Catalogue
Transport networks
Type of resources
Available actions
Topics
Keywords
Contact for the resource
Provided by
Years
Formats
Representation types
Scale 1:
Resolution
-
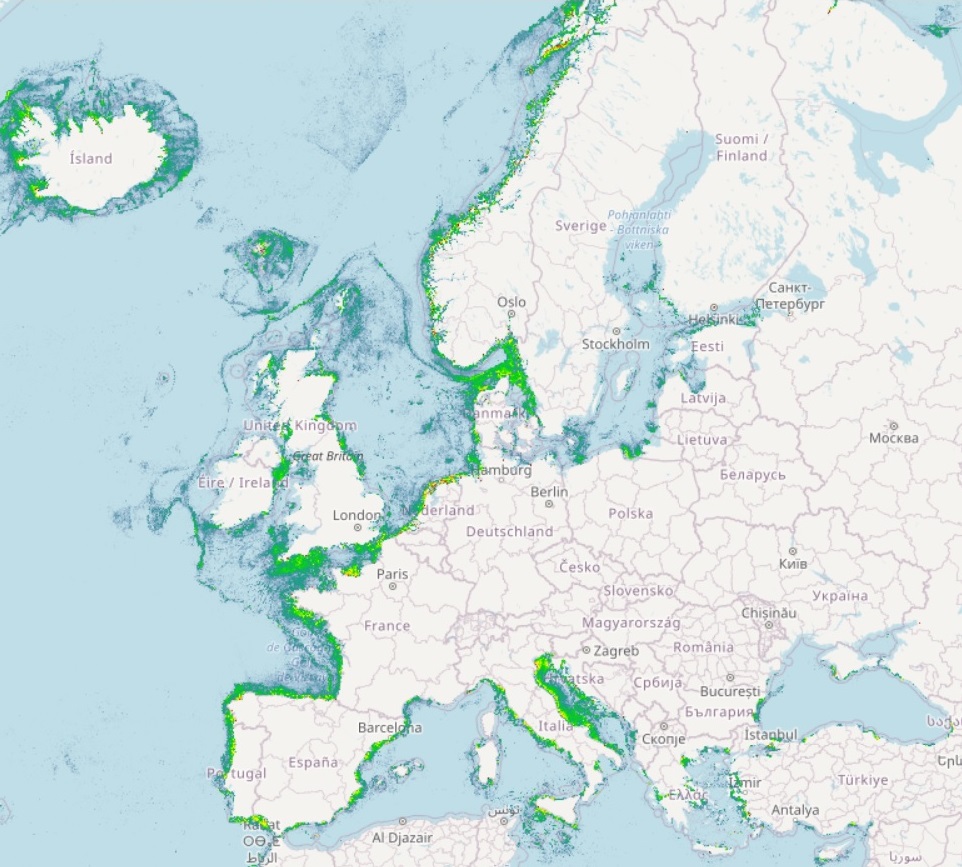
The Vessel Density maps in the EU are created since the 2019 by Cogea for the European Marine Observation and Data Network (EMODnet). The dataset is updated every year and is available for viewing and download on EMODnet web portal (Human Activities, https://emodnet.ec.europa.eu/en/human-activities). The maps are based on AIS data yearly purchased from Collecte Localisation Satellites (CLS) and ORBCOMM. The maps, GeoTIFF format, show shipping density in 1x1km cells of a grid covering all EU waters and some neighbouring areas. Density is expressed as hours per square kilometre per month. The following ship types are available:0 Other, 1 Fishing, 2 Service, 3 Dredging or underwater ops, 4 Sailing, 5 Pleasure Craft, 6 High speed craft, 7 Tug and towing, 8 Passenger, 9 Cargo, 10 Tanker, 11 Military and Law Enforcement, 12 Unknown and All ship types. Data are available by month of year. Yearly averages are also available.
-
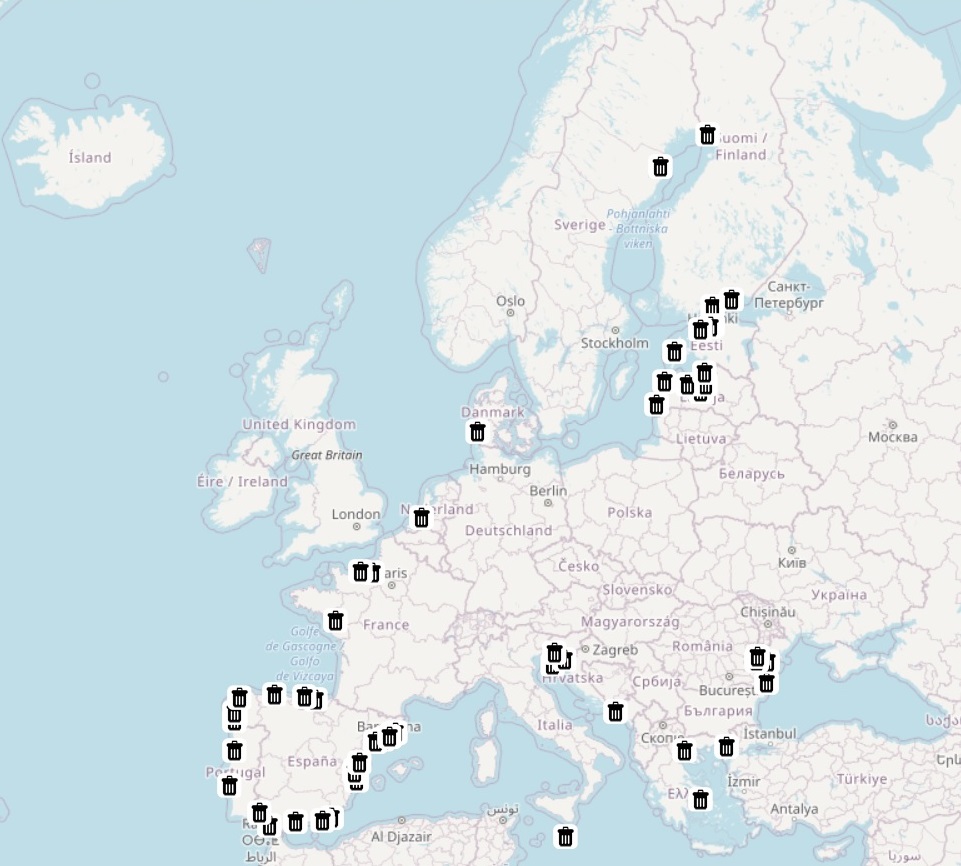
The database on waste at ports in the EU was created in 2018 by CETMAR using the Ports 2013 data available in Eurostat web page (http://ec.europa.eu/eurostat/web/main/home). It is the result of the aggregation and harmonization of datasets provided by several sources from all across the EU and is available for viewing and download on EMODnet web portal (Human Activities, https://emodnet.ec.europa.eu/en/human-activities). Following the MARPOL Convention waste at ports have been reported by Ports indistincly in cubic meters (m3) and/or in tonnes (t) and classified as oily waste (Annex I), garbage (Annex V), sewage (Annex IV), harbour waste (garbage) and total amount*. These datasets include annual data when available and are updated in the following countries: Croatia, Denmark, Estonia, Finland, France, Greece, Italy, Latvia, Malta, Netherlands, Portugal, Romania, Spain and Sweden. *Total amount only report the sum of available values for each of the given units (m3 or tonnes).
-
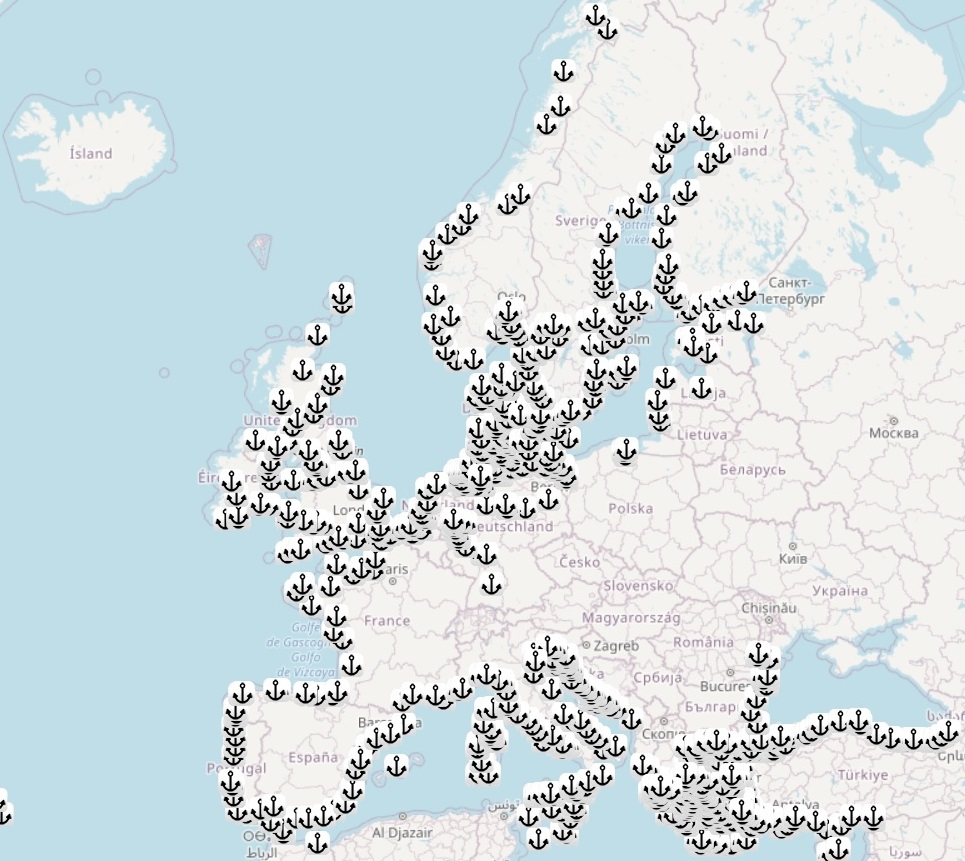
The dataset on maritime transport of goods, passengers and vessels in the European main ports was created in 2014 by Eurofish and Cogea for the European Marine Observation and Data Network (EMODnet). It is available for viewing and download on EMODnet web portal (Human Activities, https://emodnet.ec.europa.eu/en/human-activities). The dataset is the result of the harmonization and aggregation on annual basis of the quarterly Eurostat Maritime transport data, provided by port in the EU Member States, Montenegro, Norway, Turkey and the UK. It is updated every year, and is available for viewing and download on EMODnet - Human Activities web portal (https://emodnet.ec.europa.eu/en/human-activities). EUROSTAT data have been related to the 'Ports 2013' EUROSTAT GISCO's points georeferenced dataset, when available, or to the ports locations coming from other sources, as UN/LOCODE, Lloyd’s List, Marine Traffic and VESSEL TRACKER. Goods traffic data are reported in thousands tonnes by type of cargo and direction. Passengers traffic data are reported in thousands passengers (excluding cruise passengers) by direction and traffic type. Vessels traffic data are reported in unit and gross tonnage (thousands) of vessels by vessel size class and vessel type. Where available, the latest update includes data from the 1997 up to the 2023.